Dynamic-Charts
Dynamic-Charts is a high-level lib built on D3js to allow for easy and quick development of dynamically populated charts, especially thought to represent live, real-time data.
Four charts are available now (a fifth is going to be added soon): 3 bar charts (a more basic one with bars' size adjusting according to the size of the dataset plot and 2 more advanced ones for which the bar size is fixed and set on creation, and older data is discarded - in a settable ratio - to make room for new values), plus a "wheel" chart especially thought for plotting data literally "on the clock". All of these charts support multidimensional data and can be fed with custom formatted data, by setting an appropriate custom "interpreter" function, so that, for example, JSON support is easily and automatically achieved. All of them, moreover, are higly customizable in their appearance: colors, backgrounds, labels size and color, axes (position, colors, visibility, size, number of nothces), titles and so on.
Showcase #1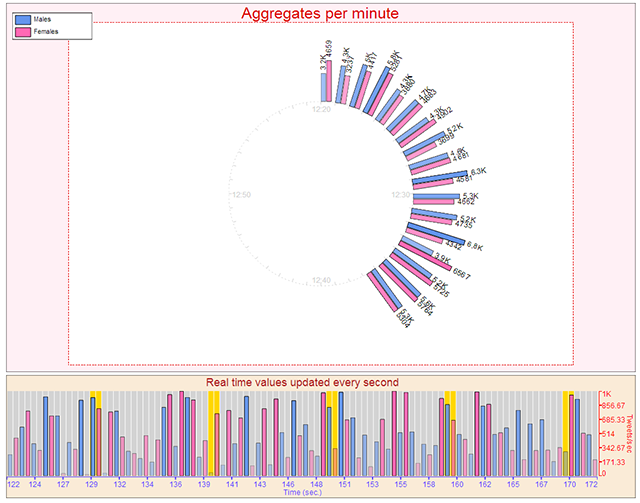 |
Showcase #2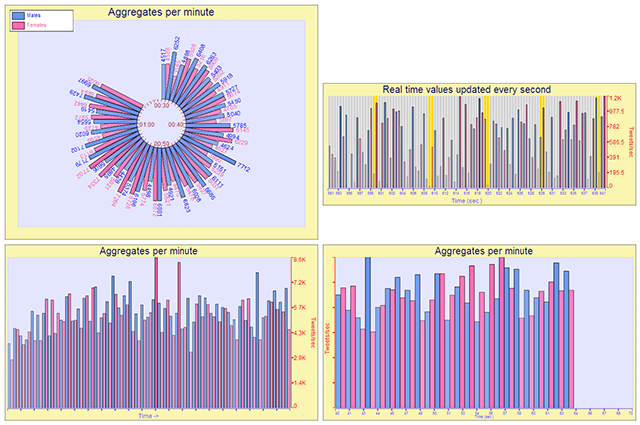 |
Please take a look at documentation here