Final project for Practical Machine Learning course
Background
Using devices such as Jawbone Up, Nike FuelBand, and Fitbit it is now possible to collect a large amount of data about personal activity relatively inexpensively. These type of devices are part of the quantified self movement – a group of enthusiasts who take measurements about themselves regularly to improve their health, to find patterns in their behavior, or because they are tech geeks. One thing that people regularly do is quantify how much of a particular activity they do, but they rarely quantify how well they do it. In this project, your goal will be to use data from accelerometers on the belt, forearm, arm, and dumbell of 6 participants. They were asked to perform barbell lifts correctly and incorrectly in 5 different ways. More information is available from the website here: http://groupware.les.inf.puc-rio.br/har (see the section on the Weight Lifting Exercise Dataset).
Task
The goal of your project is to predict the manner in which they did the exercise. This is the "classe" variable in the training set. You may use any of the other variables to predict with. You should create a report describing how you built your model, how you used cross validation, what you think the expected out of sample error is, and why you made the choices you did. You will also use your prediction model to predict 20 different test cases.
My solution
First, I loaded caret package, then the data in R. There are 160 columns, so I first took a look to see if some of them could be removed. I started looking at columns in training data. First column is just a index (the # of current row), so it can be discarded. The username column will be removed as well, because it can cause unstability and false positives (we don't want our model to be trained on usernames)
Then I started printing some features histograms and charts with two features against each other to see if I could spot patterns that could help building a good model. Most features, taken alone, wouldn't show significant patterns: they looked something like this
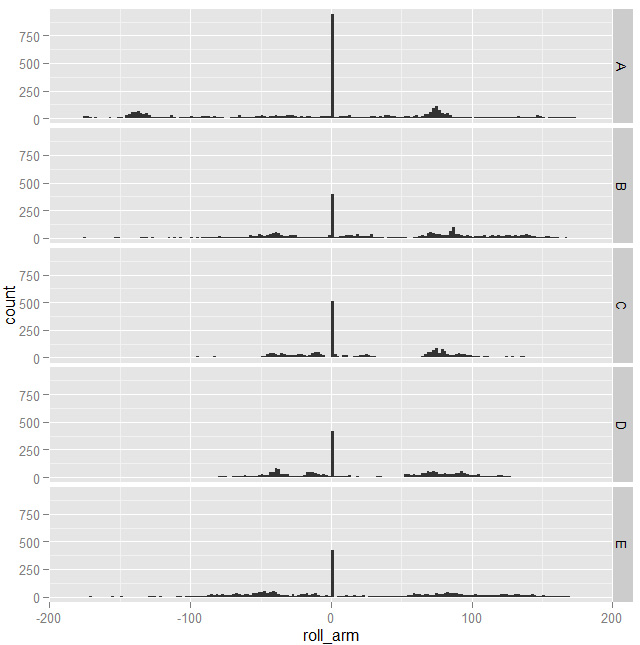
with spikes corresponding to the same values for all the classes. Moving on, not every combination of features was useful either:
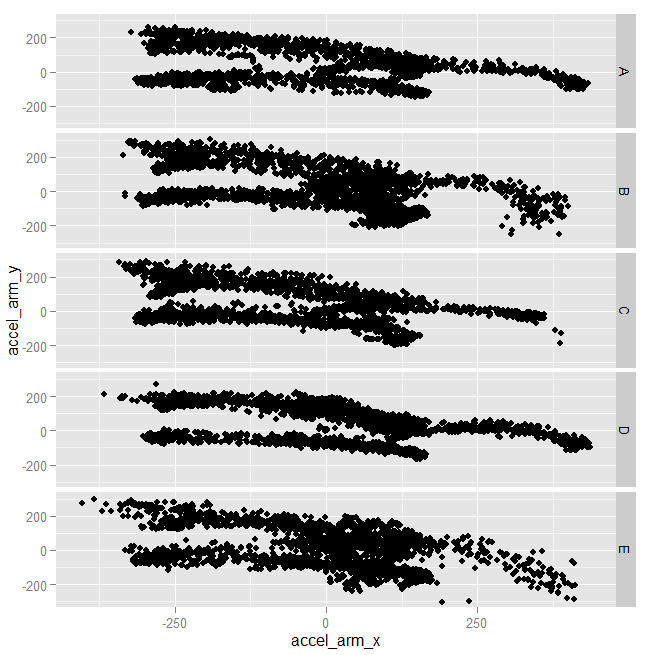
As you can see above, the shapes are almost identical for all clasees. Some combinations, instead, worked better
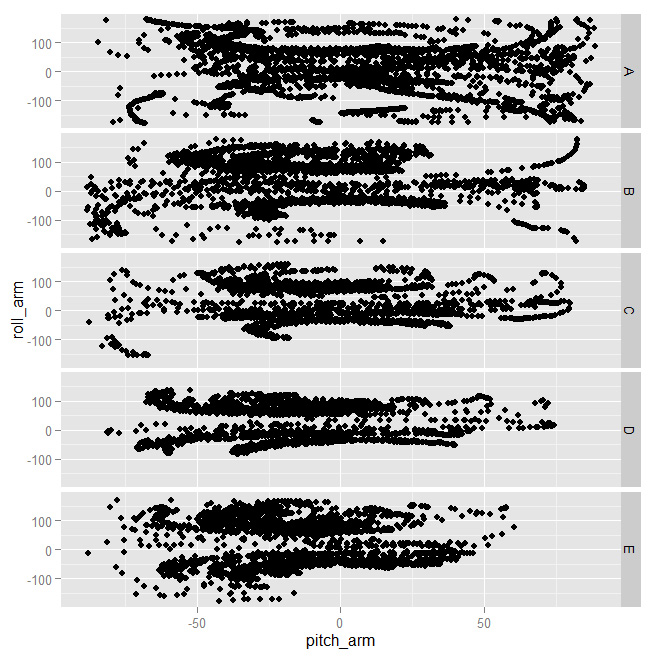
And indeed you can see very different shapes for at least some of the classes. That tells us those features will probably be important for building a good model.
I checked for columns with a high percent of data that is either NA or "", and excluded them. As expected, none of the "important" features shown above has been removed from the dataset.
I then transformed the "classe" variable in a factor var and, finally, I partitioned the training set into training and cross validation to have a measure of out-of-sample error.
Initially I was planning a model with 3 predictors: a random forest, a boosting predictor, and a linear classifier. Then I resorted to using just the latter 2, with their output then used to train another random forest on the cv set. It is a bit slow to train because of the big number of columns and rows, but a couple of hours were enough to be done with it. Probably some of the less promising columns could be eliminated, or certainly a PCA analysis could be run to reduce the dimension of the data and speed up train.
To double check performance, testing this model against the boosting predictor only, the increment in accuracy for out-of-sample error was marginal: just about 0.3%. The increment with respect to linear regression only, instead, was about 20%. Since the gbm model is the one requiring more time to train, in absence og time constraint it is still good to gain even a small improvement using bagging among multiple models, in exchange for a few more minutes required for training.
I tested the out-of-sample error on the cross-validation set and the result was very encouraging:
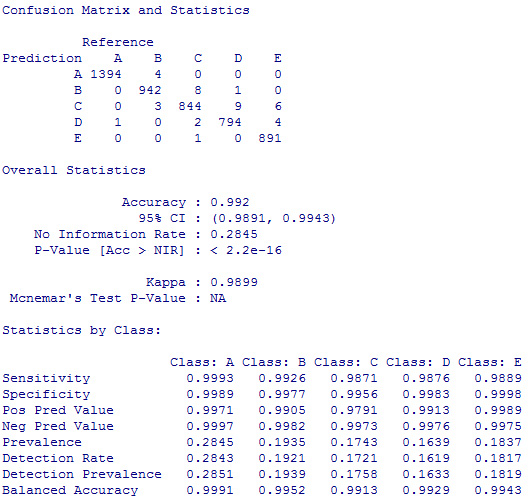
As shown above, the expected accuracy is greather than 99%. As a matter of fact, when I submitted the answers for the second part of the exercise, all 20 predictions were correct.
My script:
library(caret)
#setwd("..YOUR_PATH..")
training = read.csv("pml-training.csv", header = TRUE)

training <- training[, 6:dim(training)[2]]

treshold <- dim(training)[1] * 0.95
#Remove columns with more than 95% of NA or "" values
goodColumns <- !apply(training, 2, function(x) sum(is.na(x)) > treshold  || sum(x=="") > treshold)

training <- training[, goodColumns]

badColumns <- nearZeroVar(training, saveMetrics = TRUE)

training <- training[, badColumns$nzv==FALSE]

training$classe = factor(training$classe)

#Partition rows into training and crossvalidation
inTrain <- createDataPartition(training$classe, p = 0.6)[[1]]
crossv <- training[-inTrain,]
training <- training[ inTrain,]
inTrain <- createDataPartition(crossv$classe, p = 0.75)[[1]]
crossv_test <- crossv[ -inTrain,]
crossv <- crossv[inTrain,]

testing = read.csv("pml-testing.csv", header = TRUE)
testing <- testing[, 6:dim(testing)[2]]
testing <- testing[, goodColumns]
testing$classe <- NA
testing <- testing[, badColumns$nzv==FALSE]

#Train 3 different models
#mod1 <- train(classe ~ ., data=training, method="rf")
mod2 <- train(classe ~ ., data=training, method="gbm")
mod3 <- train(classe ~ ., data=training, method="lda")

#pred1 <- predict(mod1, crossv)
pred2 <- predict(mod2, crossv)
pred3 <- predict(mod3, crossv)

//show confusion matrices
#confusionMatrix(pred1, crossv$classe)
confusionMatrix(pred2, crossv$classe)
confusionMatrix(pred3, crossv$classe)

#predDF <- data.frame(pred1, pred2, pred3, classe=crossv$classe)
predDF <- data.frame(pred2, pred3, classe=crossv$classe)

combModFit <- train(classe ~ ., method="rf", data=predDF)
#in-sample error
combPredIn <- predict(combModFit, predDF)
confusionMatrix(combPredIn, predDF$classe)

#out-of-sample error
pred2 <- predict(mod2, crossv_test)
pred3 <- predict(mod3, crossv_test)
predDF <- data.frame(pred2, pred3, classe=crossv_test$classe)

combPredOut <- predict(combModFit, predDF)
confusionMatrix(combPredOut, predDF$classe)


pml_write_files = function(x){
  n = length(x)
  for(i in 1:n){
    filename = paste0("problem_id_",i,".txt")
    write.table(x[i],file=filename,quote=FALSE,row.names=FALSE,col.names=FALSE)
  }
}

pml_write_files(combPred)